
Charts: To taper or not to taper?
Our favourite chartist queen, Ploy, has returned to grace us with her thoughts on the the markets, exchange rates and what it all means when put together. Enjoy the read!
The question investors around the globe have been asking to themselves since May 22 when the Fed’s President mentioned in the congressional testimony of the possibility to taper the Fed’s QE program. Markets have tumbled since. I asked to myself, “is this only the beginning?â€Â Â
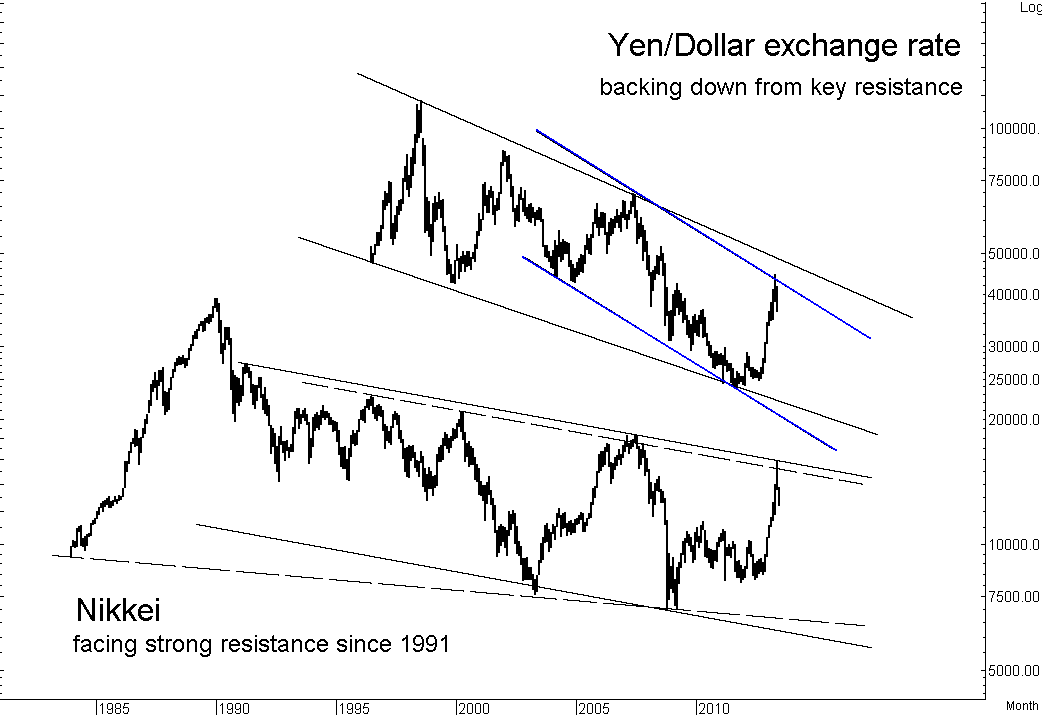
One of the best investment strategies of the year 2013 is to short the yen/long the Nikkei. However, the prosperous period might have been over. The chart below warns us that the Nikkei has a long way to go. The recent plunge of the Nikkei occurred at the strong resistance, formed since 1991. The index also fell below the neck-line at 12,548.20 this morning, and the next support is at 11,805-11,780.
The level the Nikkei may reach before regaining strength is difficult to gauge, but we may keep eyes on the supports of the Yen/Dollar rate. Yen strengthened against the U.S. dollar and breached below 95.01 yen/dollar level this morning. The currency may strengthen against the greenback to the 92.58-92.55 yen/dollar or 90.96 yen/dollar. If the rebound from either support looks solid – says, a breakout above 99.27 yen/dollar –, it may signal the rebound in the Nikkei as well.
 On the other side of the globe, the Dow Jones index is volatile around the red support line, shown in the chart below. On a fall below the 14,844.22 level, the index may head down to test the support at 14,450-14,444. Possible downside, in case of a decline below 14,444, is also shown in the chart. Resistance against the rebound is at 15,250-15,300.
 
Â
The Hang Seng index is also signaling a warning. The chart below shows that the index is forming a so-called triangle pattern. A fall below or a breakout above this triangle pattern usually signals sharp volatility. If Hang Seng falls below the 20,530 level, the lower supports are at 19,076-19,050 and 18,056-18,000.
 
 The euro-zone markets warn that they have just started their declines. The DAX index has fallen from its strong resistance, and the X-cycle support signals that the index may take until July 8, 2013 to finish its free-fall. Temporary support in the Dax is at 8,034.55 while downside at 7,750 or 7,650 is also seen.
 
Â
Looking back to our beloved SET index, the index is testing its support at 1,350 this morning. On a fall below this level, it may head down towards lower support at 1,320-1,310. The chart also shows that two support lines intersect at Point X, which is around the 1,265-1,245 level. Lower support is seen at 1,212-1,200. I’d say the 1,265-1,245 level is the level I am comfortable to tell clients to start a light re-entry, with a stoploss line at 1,200.
 
Updating on the Thai baht, below is the same chart I presented to you last time. The recent weakness in the baht remains within a downward channel, with resistances against the exchange rate at 31.26 THB/USD and 31.44 THB/USD. The THB/USD exchange rate is expected to fall back from the said barriers, and a decline below 30.82-30.80 level will confirm a return to the strengthening trend of the baht against the U.S. dollar.
Â

 While most are waiting for the FOMC’s meeting on June 18-19 to gauge when the Fed will taper its QE program, I’d recommend staying on the sideline, sipping coffee, and waiting for the indices to trigger a re-entry signal. This is just not the time to catch the falling knife. Don’t mess with the markets. 🙂
Thanks again ploy!