
Charts: China & Hong Kong
Our Queen Chartist has returned to share her thoughts and outlook on the capitalist experiment in communist china, it’s a fun read enjoy!
There is an old saying “A picture is worth a thousand words.â€
Well, the Big Brother of China has something to say.
His Little Brother has something to say, too.

I wish I could end my blog post here, but I do not wish to cause any panic attack.
Chinese government’s attempts to shore up the decline in Chinese equities finally worked this morning, being able to push both indices up slightly. Well, all after over 30% decline since mid-June and over half of the listed companies being suspended from trading. Shareholders who own over 5% of a company’s stocks are now unable to sell their stocks for the next six months. Many intervention measures have been and will be implemented, but both charts shown above made me wonder whether all the efforts will work in the end.
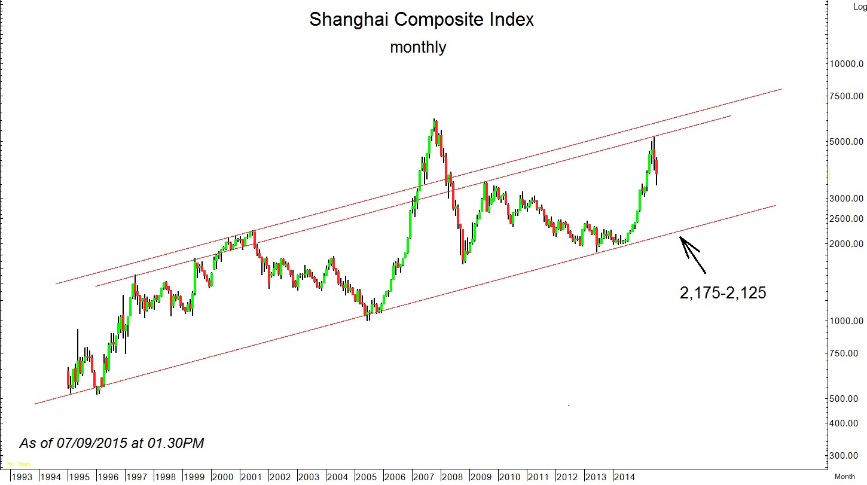
As I am writing this blog, my other screen is showing the chart of Shanghai Composite Index, in hourly time frame.

Putting it in words for those who are not Technical Analysis heads, the recent decline in Chinese equities occurred at the relatively-strong monthly resistance. The last two times that Shanghai Composite Index hit this resistance level were pre-Dot Com crisis and pre-Subprime crisis. I am not saying that we are at the beginning of Made-In-China Crisis, yet, but the momentum and magnitude built at this resistance line can bring the index down pretty severely.
As in Shanghai Composite index, this morning’s rebound has brought the index to test the resistance line at 3,830, and if the index fails to breach above this level, it may retreat and continue its decline towards the 3,225-3,200 level. Lower support line is found at 3,080-3,050.
If the index can breach above the 3,830 level, the breakout should give an index a support to rebound towards 3,975 and 4,300-4,320 levels.
However, given the long-term chart, the fact that the index corrected form a significant resistance line, and increasing signs of China’s economic slowdown, I’d use the rebound to cut back on my exposure in Chinese equities and stay away from China for a while.
As of now, the resistance and support levels given below may be used to observe the market

On the more highly-observed Hang Seng China Enterprises Index, the chart looks less bearish and the index seems to be consolidating at and rebounding from its long-term support at 10,700-10,650. It still has to breach above the resistance levels at 12,300 and 13,080-13,120 in order for the rebound to look more sustainable.

Should the support line at 10,700-10,650 level fail to hold the HSCEI index, the daily chart shown below yields nearby support levels at 10,555-10,540 and 9,975-9,960.

Again, I am not saying that we are at any pre-crisis moment, yet, but China is a big chunk of mysterious meat to me, and I am not confident that the intervention measures the Chinese government is doing will work at the end of the day. If I had any exposure in Chinese equities at the moment, and they are not suspended from trading, and given the current economic conditions, I would liquidate them on rebound to ensure that I would sleep better at night.
Xavi
This is very scary, the Chinese Govt has broken the market, this will not end well when all the trading halts and bans get lifted we will see a massive dive far greater than the last 3 weeks.
Don McMahon
Would you please comment on BJCHI’s chart? I am a long term investor. But I’ve been burned by not taking action when this stock has bottomed and peaked several times in the past 8 months, due to my being a rank amateur at reading the technicals. Is there a good place to start learning ? Thanks in advance. Don.
Pon
I only look at the squiggley lines to try to understand what has happened in the past with the stock and the volumes, but I don’t use it to make a decision of whether a company/stock is a good investment, that I base on my own assumptions of the company’s fair value and the risk/return related to the investment.
Technical analysis – long debate, my own analogy is that…its like a doctor look at your latest Heart beat EKG, it gives a picture of the past but nothing for the future.